
Dow vs. Nasdaq vs. S&P 500: Key Differences and Investment Insights
Dow Jones, NASDAQ Composite, and S&P 500 indices are the most widely influential stock market indices in the United States equity market. Each index serves as a benchmark, reflecting different segments of the U.S. economy and the performance of publicly traded companies.
These indices do not measure the same segment of the market. Instead, they are built on different methodologies, weightings, and sector allocations. Because of these differences, investors often compare the Dow, S&P 500, and Nasdaq when deciding how to allocate their capital.
Understanding these differences is crucial for making informed investment decisions in 2025 and beyond. In this blog, you’ll get a clear breakdown of the differences between Dow vs. Nasdaq vs. S&P 500, helping you understand which one fits your investment strategy in 2025 and beyond.

What are the Dow Jones, NASDAQ, and S&P 500?
The Dow Jones, NASDAQ, and S&P 500 are the top three most prominent U.S. stock market indices. These indices track major publicly traded companies, offering insight into the overall health and trends of the U.S. stock market.
These indices are often used by investors, fund managers, and economists to understand the direction of the U.S. stock market, gauge economic health, and shape trading decisions.
- The Dow Jones Industrial Average tracks 30 large-cap, blue-chip companies. It’s price-weighted and focuses on industrial and legacy sectors.
- The NASDAQ Composite Index includes over 3,000 companies, mostly tech-heavy and growth-oriented firms. It’s known for its volatility and innovation.
- The S&P 500 Index tracks 500 leading U.S. companies across various sectors. It’s a market-cap-weighted index widely used to represent the overall U.S. stock market.
Together, these indices help investors gauge market sentiment, diversify portfolios, and understand where money is flowing in the economy.
What is Dow Jones Industrial Average (DJIA)?
The Dow Jones Industrial Average (DJIA), commonly referred to as the Dow, is one of the oldest and most recognized stock market indices in the world. Charles Dow and Edward Jones introduced it in 1896 to measure the performance of America’s industrial economy.
Although DJIA was originally made up of just 12 companies, it now includes 30 of the largest and most influential U.S. corporations, such as Apple, Microsoft, Boeing, Johnson & Johnson, and Coca-Cola. Unlike broader indices, the DJIA focuses on established, large-cap companies that represent economic stability.
| Key Characteristics | Details |
|---|---|
| Launch Year | 1896 |
| Number of Companies | 30 |
| Index Type | Price-weighted Index |
| Market Segment | Blue-chip, large-cap U.S. companies |
| Weighting Method | Companies with higher share prices have more influence |
| Sectors Represented | Industrials, financials, healthcare, consumer goods, and energy |
| Limitations | Limited tech exposure; price weighting can skew performance |
How the Dow Jones Works
DJIA uses a price-weighted method, which means stocks with higher share prices carry more weight—regardless of their market capitalization. For instance, a $500 stock like UnitedHealth impacts the index more than a $150 stock like Coca-Cola, even if Coca-Cola has a higher market cap
This approach gives more influence to expensive stocks, which can distort the overall picture, especially in a market increasingly dominated by tech and growth companies.
Sector Focus and Limitations of Dow Jones:
Dow primarily reflects traditional sectors like industrials, healthcare, finance, consumer goods, and energy. As a result, it captures the performance of legacy businesses rather than fast-growing tech startups.
While it offers valuable insights into long-standing corporations, it doesn’t provide a comprehensive view of the modern U.S. economy. Because it only includes 30 companies, the DJIA lacks the broad exposure of indices like the S&P 500 or the Nasdaq Composite. This narrower scope makes it less effective for tracking overall market dynamics.
Investing in the Dow Jones in 2025:
The Dow is ideal for conservative investors who prefer stable, dividend-paying companies with a proven track record. It serves as a reliable indicator of U.S. economic health, especially in traditional sectors.
However, due to its price-weighted structure and limited tech presence, it may not suit investors seeking broader exposure or growth-driven portfolios.
What is the S&P 500 (Standard & Poor’s 500)?
The S&P 500, short for Standard & Poor’s 500, is widely regarded as the most accurate reflection of the U.S. stock market. Launched in 1957 by Standard & Poor’s, the index tracks 500 of the largest publicly traded U.S. companies across all 11 major sectors, including technology, healthcare, energy, consumer goods, and financials.
The S&P 500 is market-cap-weighted, meaning companies with larger market capitalizations exert greater influence on the index’s movements. As a result, firms like Apple, Microsoft, Amazon, Alphabet (Google), and Berkshire Hathaway dominate the index.
Unlike the Nasdaq Composite, which primarily lists tech-heavy stocks from the Nasdaq exchange, the S&P 500 includes companies from both the New York Stock Exchange (NYSE) and Nasdaq, offering broader market exposure. That’s why it’s a preferred benchmark for institutional and retail investors alike.
Because it covers roughly 80% of the total U.S. equity market capitalization, the S&P 500 serves as the default index for passive investing, index funds, and ETFs. It’s the backbone of major investment products like SPY, VOO, and IVV.
| Key Characteristics | Details |
|---|---|
| Launch Year | 1957 |
| Number of Companies | 500 |
| Index Type | Market-cap-weighted Index |
| Market Segment | Broad U.S. market, large-cap equities |
| Weighting Method | Larger market cap = greater influence |
| Sectors Represented | All 11 sectors (e.g., tech, healthcare, financials, energy) |
| Limitations | Top-weighted stocks can over-influence overall index performance |
How the S&P 500 Works
The S&P 500 uses float-adjusted market capitalization, which considers only the publicly available shares of a company, ensuring a more accurate reflection of actual market sentiment. The index is rebalanced quarterly, and companies must meet specific profitability and liquidity standards to be included.
Its diverse composition, ranging from Apple and Microsoft to ExxonMobil and JPMorgan Chase, allows investors to gain broad exposure to multiple sectors through a single index.
Sector Focus and Limitations of the S&P 500
S&P 500 is diversified across all sectors, making it the most balanced of the three indices. Its largest weight is typically in technology, followed by healthcare, financials, consumer discretionary, and energy.
However, it tends to overweight mega-cap tech companies, which can distort sector balance over time. For example, in recent years, Apple and Microsoft alone have made up more than 10% of the index. While this boosts returns during tech rallies, it also introduces concentration risk.
Investing in the S&P 500 in 2025
The S&P 500 is ideal for long-term, passive investors seeking diversified exposure to the U.S. economy. Its historical average annual return of ~10% (before inflation) makes it a compelling choice for building wealth over time. Despite its strengths, it’s still subject to market cycles and downturns, so risk tolerance and investment horizon remain key considerations.
What is the Nasdaq Composite?
The NASDAQ Composite Index is one of the most tech-heavy and growth-oriented indices globally. Launched in 1971, it includes over 3,000 companies listed on the NASDAQ Stock Market, ranging from giant tech titans to smaller, high-growth startups.
Unlike the Dow, the Nasdaq is market capitalization-weighted, meaning that companies with larger total market value have a greater influence on the index’s performance. Due to its tech-centric nature, the Nasdaq often exhibits higher volatility but also offers greater growth potential, particularly during bullish market trends.
| Key Characteristics | Details |
|---|---|
| Launch Year | 1971 |
| Number of Companies | 3,000+ |
| Index Type | Market-cap weighted Index |
| Market Segment | Technology, biotech, growth-oriented companies |
| Weighting Method | Companies with larger market caps have a greater impact |
| Sectors Represented | Tech, e-commerce, communication services, healthcare |
| Limitations | Highly volatile; heavy tech bias; less diversified sectoral exposure |
How the Nasdaq Works
The market-cap weighting used in the Nasdaq gives tech giants like Apple, Microsoft, Amazon, Meta, and Nvidia significant sway over the index. As these companies grow, they push the index higher; when they falter, the index can drop sharply.
This makes the Nasdaq more volatile compared to the Dow or the S&P 500, but also more responsive to innovation trends, making it a favorite for growth investors.
Sector Focus and Limitations of Nasdaq
The Nasdaq is heavily tilted toward technology and high-growth sectors, including artificial intelligence, cloud computing, semiconductors, e-commerce, and biotech. It’s often seen as a barometer for tech stock performance.
However, this tech-heavy exposure also makes it vulnerable during periods of rising interest rates or economic uncertainty—when investors tend to rotate away from high-growth companies and toward value-oriented sectors.
Investing in the Nasdaq in 2025
The Nasdaq is well-suited for investors who are comfortable with higher volatility, interested in disruptive innovation, and seeking long-term capital appreciation. However, it’s not ideal for investors looking for sector diversification or consistent dividend income.
Quick Comparison Table: Dow vs. S&P 500 vs. Nasdaq
Here is a quick comparison between the three major U.S. stock indices, including market focus, tech exposure, volatility, and more, to help you choose the right index based on your investment goals.
| Factor | Dow Jones | S&P 500 | Nasdaq Composite |
|---|---|---|---|
| Type of Index | Price-weighted index | Market-capitalization-weighted index | Market-capitalization-weighted index |
| Number of Companies | 30 large-cap companies | 500 large-cap U.S. companies | Over 3,000 companies |
| Market Focus | Blue-chip, multinational firms | Broad representation of the U.S. economy | Heavily tech-focused |
| Exchange | NYSE & NASDAQ | NYSE & NASDAQ | Primarily NASDAQ |
| Tech Exposure | Moderate | Moderate to high | Very high |
| Weighting Methodology | Based on the stock price | Based on market capitalization | Based on market capitalization |
| Volatility | Low to moderate | Moderate | High |
| Sector Concentration | Industrials, financials, consumer goods | Diversified across all 11 sectors | Technology, biotech, and growth stocks |
| Historical Start Date | 1896 | 1957 | 1971 |
| Ticker Symbol | ^DJI or DJI | ^GSPC or INX | ^IXIC |
| Common Use | Economic sentiment indicator | Benchmark for fund performance | Gauge of tech sector and growth stocks |
| Investor Type | Long-term conservative investors | Broad market exposure seekers | Growth-focused and tech investors |
| Examples of Top Companies | Apple, Goldman Sachs, Boeing | Apple, Microsoft, Amazon, Nvidia | Apple, Microsoft, Amazon, Meta, Google |
Detailed Performance Comparison: Dow vs S&P 500 vs Nasdaq
Understanding the historical performance and volatility of the Dow Jones Industrial Average, S&P 500, and Nasdaq Composite is crucial for investors aiming to make informed decisions in today’s market. Each index reflects unique segments of the U.S. economy, carries different risk profiles, and offers varied growth prospects.
Here is a detailed comparison to help you understand how to choose between Dow, Nasdaq, and S&P 500, and what this means for your investment strategy in 2025:
2025 Year-to-Date Performance
From January to early August 2025, the Nasdaq Composite has outperformed both the Dow Jones and S&P 500, gaining approximately 11.1%. This growth is fueled by strong performances in technology, artificial intelligence, and the semiconductor sectors.
The S&P 500 follows with an 8.6% increase, supported by broad-based strength across healthcare, consumer discretionary, and financial sectors.
Meanwhile, the Dow Jones Industrial Average, with its focus on more traditional blue-chip companies like industrials and consumer staples, has experienced a more modest 3.8% gain. This reflects its relative defensive posture during the current market environment.
Historical Returns Over the Past Decade
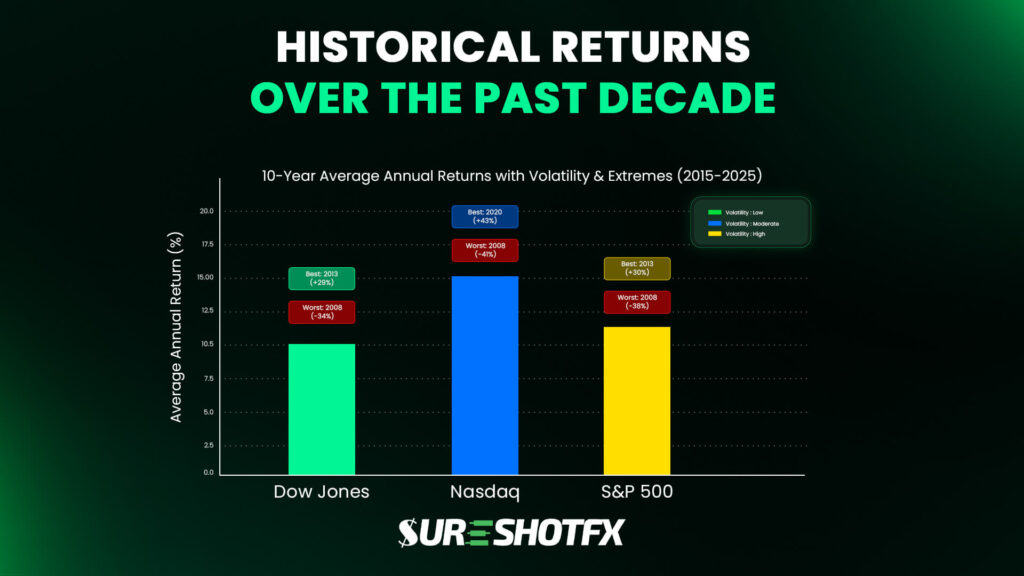
Over the past decade, the Nasdaq Composite has emerged as the clear leader in terms of total returns among the three indices. Here’s a summary of the average annual returns from 2015 through 2025 for each index:
| Index | 10-Year Average Annual Return | Volatility Level | Best Year | Worst Year |
|---|---|---|---|---|
| Dow Jones | ~10% | Low | 2013 (+29%) | 2008 (−34%) |
| Nasdaq | ~15% | High | 2020 (+43%) | 2008 (−41%) |
| S&P 500 | ~12% | Moderate | 2013 (+30%) | 2008 (−38%) |
Long-Term Returns and Volatility
When evaluating investment options, understanding long-term returns alongside volatility is critical to assessing risk and reward. Over extended periods, Nasdaq offers the highest long-term returns but comes with greater volatility due to its tech-heavy focus.
The S&P 500 balances solid returns with moderate volatility thanks to broad sector diversification. The Dow Jones has the lowest volatility, focusing on stable, dividend-paying blue-chip companies. However, its price-weighted methodology can sometimes skew index movements.
So, investors should choose based on their individual risk tolerance and growth objectives.
Performance in Market Downturns
Each index behaves differently during market corrections and financial crises:
- Dow Jones Industrial Average: Often declines the least because of its focus on established, dividend-paying companies in defensive sectors like healthcare and consumer staples.
- S&P 500: Experiences moderate losses due to its broad diversification across all sectors, which helps absorb shocks during downturns.
- Nasdaq Composite: Usually suffers the largest declines as investors sell off volatile tech and growth stocks first during risk-off periods.
Sector Leadership and Rotation Trends
Sector leadership varies significantly across the Dow, S&P 500, and Nasdaq, influencing their performance.
- The Nasdaq is heavily tech-focused, led by giants like Apple, Microsoft, and Nvidia. These sectors thrive during growth phases but can experience sharp declines during economic uncertainty or rising interest rates.
- The S&P 500 is broadly diversified across all major sectors. Technology often leads, while energy, financials, and healthcare rotate in during inflation or recovery periods. Defensive sectors like utilities and consumer staples gain importance in downturns.
- The Dow emphasizes stability with established companies in industrials, healthcare, and consumer staples. It sees fewer frequent sector shifts, providing steady performance during volatile markets.
Understanding these rotation patterns helps investors position their portfolios according to economic cycles and market trends.
Dividend Yield and Growth Potential
The Dow Jones has the highest dividend yield at about 1.8%, focusing on established blue-chip companies that pay dividends, making it attractive for income-focused investors.
The S&P 500 provides a moderate yield of around 1.3%, balancing dividend income with growth potential across a diverse sector mix.
Meanwhile, the Nasdaq Composite has the lowest yield, roughly 0.7%, as its tech-heavy firms reinvest earnings for growth rather than dividends, appealing to investors seeking long-term capital appreciation.
Which Index Should I Invest in 2025?
Choosing the right index to invest in depends largely on your financial goals, risk tolerance, and investment horizon.
• If you prioritize stability and income:
The Dow Jones Industrial Average is a strong choice. Its focus on large, established companies with reliable dividends provides steady income and lower volatility, making it ideal for conservative investors or those nearing retirement.
• If you want broad market exposure with balanced growth:
The S&P 500 is often recommended. It offers diversified sector exposure and a mix of growth and income potential, suitable for most long-term investors seeking steady appreciation with moderate risk.
• If you seek aggressive growth and can tolerate volatility:
The Nasdaq Composite may be the best fit. Its heavy weighting in technology and innovative sectors offers higher growth potential but comes with increased risk and price swings. This index suits investors with a longer time horizon and a higher risk appetite.
How to Invest in Dow, Nasdaq, and S&P 500 in 2025
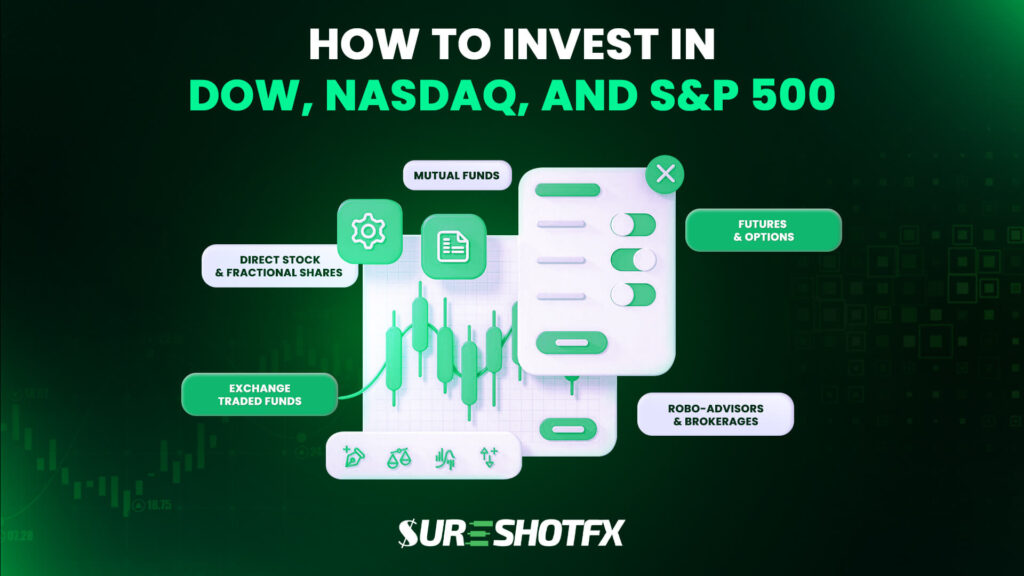
Investing in these major U.S. stock indices has never been easier, thanks to a variety of accessible financial products designed for all types of investors. Here’s how can invest in these major indices easily through:
- Exchange-Traded Funds (ETFs): ETFs are the most popular and convenient way to invest in these indices. Buy popular ETFs like DIA (Dow), SPY or VOO (S&P 500), and QQQ (Nasdaq) that track these indices.
- Mutual Funds: Many mutual funds also track these indices, providing professionally managed options for investors who prefer a hands-off approach. These funds pool investors’ money to buy stocks that replicate the index.
- Robo-Advisors & Brokerages: Robo-advisors automatically build diversified portfolios that often include index ETFs like those tracking the Dow, S&P 500, and Nasdaq. Most online brokerages also offer easy access to buy and sell these ETFs and funds with low fees.
- Futures & Options: For advanced investors or traders, futures and options contracts on these indices provide tools for speculation, hedging, or leveraging exposure to index movements.
- Direct Stock Purchase Plans (DSPPs) and Fractional Shares: Some platforms allow investors to buy fractional shares of ETFs or stocks within these indices, lowering the barrier to entry and enabling dollar-cost averaging even with small amounts.
Consider your risk tolerance and diversify to balance growth and stability. ETFs are the simplest way to get started with broad market exposure.
Where do I Get the Best Dow Jones and Nasdaq 100 Signals?
For traders seeking reliable US30 (Dow Jones) and Nasdaq 100 signals, SureShotFX stands out as a premier provider. Renowned news portals like Benzinga, Street Insider, and Digital Journal claimed SureShotFX as the top Free and Paid NAS100 and US30 Signals distributors in 2025.
Their Telegram channels offer daily, actionable trade alerts with clear entry, stop-loss, and take-profit levels. In addition to their free channels, SureShotFX offers VIP access with more frequent and detailed signals, catering to both novice and experienced traders.
Conclusion: Which Index is Best for Investing?
Choosing between the Dow Jones, S&P 500, and Nasdaq depends on your goals and risk tolerance. The Dow offers stability and dividends, the S&P 500 provides broad exposure, and the Nasdaq targets high growth with more volatility.
For smarter trades, rely on trusted signals from SureShotFX.
Get started with SureShotFX today!
FAQs

It depends on your risk tolerance and investment goals. NASDAQ offers higher growth potential but with more volatility, while S&P 500 provides broader market exposure and moderate risk.
The Dow tracks 30 large, established companies and is price-weighted, focusing on traditional industries. NASDAQ includes over 3,000 companies, is market-cap weighted, and is heavily tech-oriented.
NASDAQ tends to outperform during tech-driven bull markets due to its concentration in high-growth technology and innovation companies.
The Dow includes 30 large companies and is price-weighted, while the S&P 500 tracks 500 companies with market-cap weighting, providing broader market coverage.
The S&P 500 is broader and more diversified across sectors, while Nasdaq is more concentrated in technology and growth stocks.

2 Comments