Unlock a Lifetime of Trading Growth and Success
Thousands of traders trust SureShotFX’s unique forex signal services and software solutions to boost their trading profits across a multitude of countries and territories globally.
Join 50,000+ Members Benefitting from Our Free Signals
Explore Our Latest Free Signal Results
xauusd
Profit 46
sell4672
sl4680
tp4648
gbpaud
Profit 105
sell1.92814
sl1.934
tp1.91
us30
Profit 123
buy45602.6
sl45494.6
tp45904.6
xauusd
Profit 204
sell4578.32
sl4587.29
tp4555.29
Discover Success with SureShot FX
Join us on your journey to smart, sustainable trading growth.
Our Transparency
At SureShot FX, we champion transparency, trust, and accuracy. We openly display our trade results, offering an insight into our successful Forex signal services.
Proof in Performance
We stand by our trade results. They're real, verifiable, and integral to showcasing our success. It's this honesty that solidifies our reputation as a trustworthy Forex signal provider.
Trading Analysis Simplified
We empower clients by simplifying complex trading strategies. Our detailed analysis provides a comprehensive understanding of Forex trading, boosting your confidence and profitability.
Learning Success Strategies
We guide clients through our complete trading plan. This knowledge-sharing approach allows you to learn and capitalize on profitable opportunities, leading to a surefire Forex trading strategy.
Recognized by the Leading Media Outlets
As Featured On


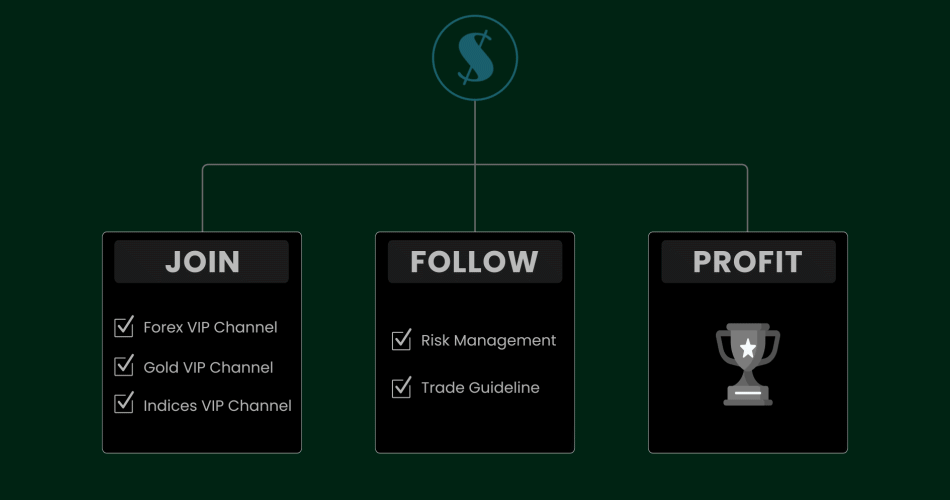
The Forex Growth Management Blueprint
Discover our proven roadmap to boost your trading profits as you scale.
Our Products and Solutions
Boost your trading profits and streamline your financial operations with SureShotFX
Forex Signals
Maximize your trading potential with expert-tailored Forex Signals, delivering real-time information for strategic decision-making.
Gold Signals
Confidently trade gold with our precise Gold Signals, guiding you towards profitable market opportunities.
Indices Signals
Gain a trading edge with our Indices Signals, providing expert insights into stock indices for informed, successful trades.
Combo Signals
Explore our Combo package, merging premier Forex, Gold and Indices Signals for unparalleled market coverage and opportunities.
Our Trusted Broker & Partner
Open eightcap account and deposit to unlock all VIP service

Useful Blogs to Read
Explore Expert Insights and Latest Trends in Forex Trading


