
What is Support and Resistance in Forex Trading?
Understanding what is support and resistance in forex trading is one of the first and most important steps for anyone learning how the currency market works. These two concepts form the backbone of technical analysis and are used daily by both retail traders and large financial institutions.
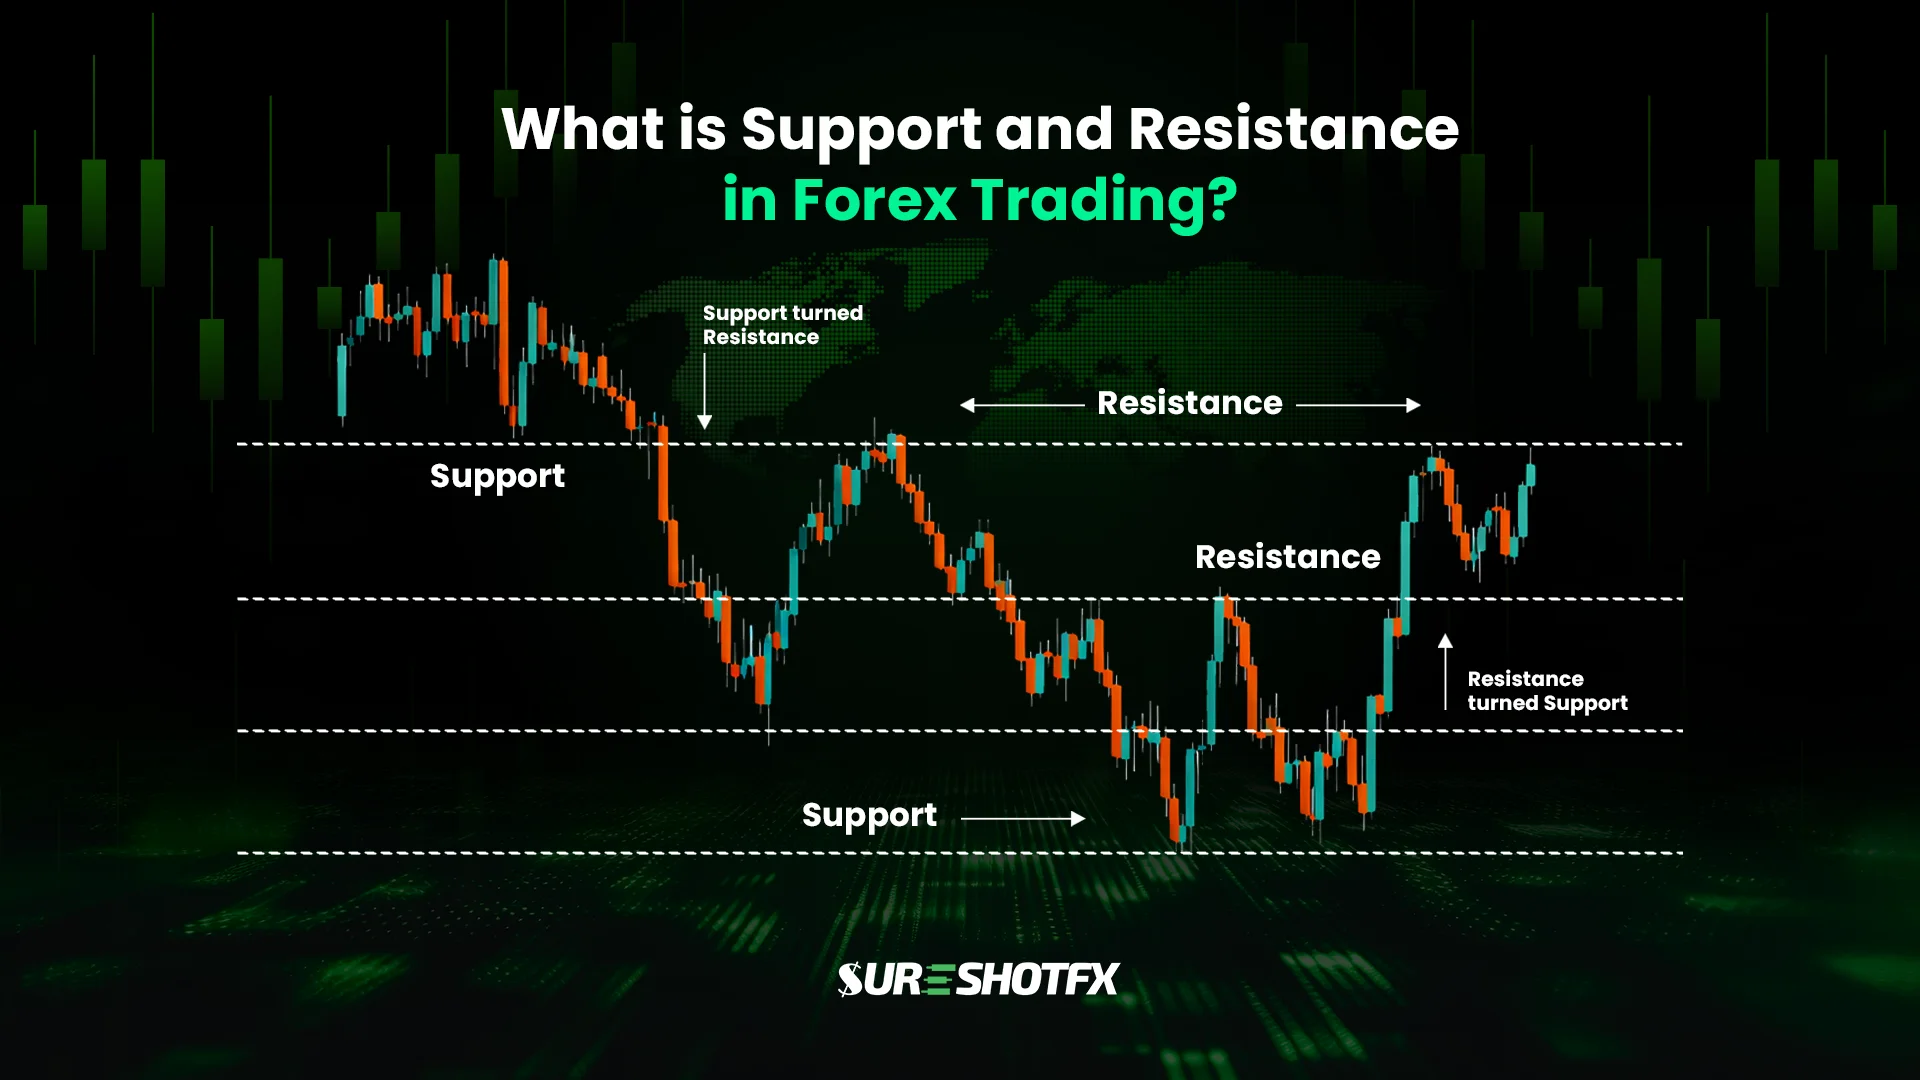
In simple terms, support is a price level where a falling market tends to pause or reverse because buying interest increases. Resistance is the opposite: a level where a rising market struggles to move higher because selling pressure builds up.
These levels exist because markets are driven by human behavior and institutional decisions. From a forex trading basics perspective, support and resistance help traders:
- Identify potential entry and exit points
- Manage risk more effectively
- Understand market structure and trend behavior
At its core, support and resistance help traders answer one crucial question: Where is price most likely to react next?

What is Support in Forex Trading?
Support is a price level where a currency pair tends to stop falling and start moving upward. It forms because buyers believe the price is “cheap enough” and step in aggressively. When demand outweighs supply, price stabilizes or reverses.
Support is not a single magic line. It’s a zone where buying pressure historically overpowered selling pressure. The more times price respects that zone, the stronger the support becomes.
From a behavioral standpoint, support exists because traders remember pain and opportunity. Buyers who missed earlier entries wait for the price to return. Sellers take profit. Institutions defend positions.
Types of Support Levels
Horizontal Support
Horizontal support is the most common type. It forms when price repeatedly stops falling around the same level, creating a clear floor. This type of support is easy to identify and widely used, which makes it powerful because so many traders are watching it.
Trendline Support
Trendline support appears in trending markets. When price forms higher lows in an uptrend, a diagonal trendline can be drawn connecting those lows. This type of support reflects momentum and helps traders stay aligned with the trend.
Moving Average (Dynamic) Support
Moving average support, often called dynamic support, shifts with price. Tools like the 50 EMA or 200 EMA act as flexible support zones. Instead of reacting at a fixed price, the market responds to a moving benchmark that reflects recent price behavior, making it common in strong trends.
What is Resistance in Forex Trading?
Resistance is the opposite force. It’s a price level where upward movement slows down or reverses because selling pressure increases. Traders view the price as “too expensive,” so supply overwhelms demand.
Psychologically, resistance is built on regret and caution. Traders who bought lower sell to lock profits. Traders who lost earlier exit at break-even. Institutions unload positions. Price struggles because too many want out.
Types of Resistance Levels
Horizontal Resistance
Horizontal resistance forms when price repeatedly fails to break above a certain level. These zones often align with previous highs and become magnets for sell orders and profit-taking.
Trendline Resistance
Trendline resistance develops in downtrends, where price forms lower highs. A descending trendline helps visualize where sellers consistently step in, reinforcing bearish momentum.
Dynamic Resistance
Dynamic resistance comes from indicators like EMAs and VWAP. Just as moving averages can act as support, they can also cap price during downtrends. Dynamic resistance suits traders who prefer adaptive levels instead of fixed price points.
Why Support and Resistance Matter in the Forex Market?

Support and resistance matter in the Forex market because they help traders understand price behavior and market psychology. These levels represent areas where buying or selling pressure has historically been strong enough to stop or reverse price movements.
The reason why support and resistance levels are important is that they help traders identify high-probability entry and exit points. Instead of entering trades randomly, traders can wait for prices to react near these key levels. Buying near support and selling near resistance allows traders to enter the market with clearer risk boundaries.
Support and resistance levels define structure and play a vital role in risk management. Traders commonly place stop-loss orders just beyond these levels to limit potential losses if the market moves against them. Because these zones often act as barriers, a strong break above resistance or below support can signal a shift in market sentiment.
This helps traders quickly reassess their positions and adapt to changing market conditions. As a result, support and resistance serve as foundational tools that enhance both technical analysis and overall trading confidence.
Support vs Resistance — Key Differences
The debate of support vs resistance isn’t about which one is more important; it’s about understanding their roles. Support reflects buyer dominance, while resistance reflects seller dominance. Both are expressions of market structure and sentiment.
| Feature | Support | Resistance |
|---|---|---|
| Market control | Buyers dominate | Sellers dominate |
| Typical reaction | Price bounces up | Price moves down |
| Role reversal | Can become resistance | Can become support |
Support and resistance are not isolated tools. They are structural elements of the market, shaping trends, ranges, and reversals. Understanding their differences helps traders read price action with clarity instead of confusion.
Role of Support and Resistance in Chart Patterns
Support and resistance play a central role in the formation and interpretation of chart patterns in Forex trading. Most chart patterns emerge because price repeatedly reacts to specific support and resistance zones. These levels act as natural boundaries that shape price movement, helping traders visually recognize patterns such as ranges, breakouts, and consolidations.
Many classic chart patterns are built directly around support and resistance levels. For example, double tops and double bottoms form when price fails to break through a resistance or support level after multiple attempts. Similarly,head and shoulders patterns rely on a well-defined resistance line (neckline) that, when broken, signals a potential trend reversal. These patterns become reliable because they reflect repeated market reactions at the same price levels.
Support and resistance also define breakout patterns and continuation setups. Patterns liketriangles, flags, and rectangles develop as price compresses between rising support and falling resistance or moves sideways within horizontal levels. A decisive break above resistance or below support often confirms the pattern and signals strong momentum in the breakout direction. Traders use these levels to anticipate entries, set stop-loss orders, and project price targets.
Additionally, support and resistance help traders confirm chart patterns and reduce false signals. A pattern becomes more credible when it aligns with clearly respected support or resistance zones across multiple timeframes. When price breaks a key level with strong volume or momentum, it increases confidence that the pattern is valid.
This makes support and resistance essential tools for improving accuracy and consistency when trading Forex chart patterns.
Support and Resistance Level Trading Strategies
Support and resistance are not strategies by themselves; they are frameworks. Once traders understand the levels, the next step is applying them. Support and resistance trading strategies are widely used because they are simple, flexible, and effective when combined with confirmation.
Different strategies suit different market conditions, but all rely on clear levels and disciplined execution.
Bounce Strategy
The support resistance bounce strategy focuses on entering trades when price respects a well-established level. Instead of guessing, traders wait for confirmation through price action forex signals such as rejection wicks, engulfing candles, or increased volume. The logic is simple: if a level has held before and shows signs of defense again, the probability of a bounce increases.
This strategy works best in ranging or slowly trending markets, where levels have been tested multiple times.
Breakout Strategy
The support resistance breakout strategy targets moments when price decisively moves beyond a key level. The challenge here is avoiding the false breakout forex trap, where price briefly breaks a level only to reverse sharply.
Experienced traders look for strong momentum, volume expansion, and often a retest of the broken level. A successful retest confirms that the old support or resistance has flipped roles, strengthening the trade setup.
Role Reversal Strategy
The role reversal trading strategy, also known as flip zones forex, builds on the idea that markets remember important levels. When former resistance becomes support, it often creates high-probability continuation trades. These setups are popular because they align structure, psychology, and order flow into a single narrative.
What Happens if a Price Breaks Through its Support or Resistance Level?
When a price breaks through a support or resistance level, it usually indicates a change in market strength and trader sentiment. A breakout above resistance shows that buyers are willing to pay higher prices, overpowering selling pressure. Conversely, a break below support suggests that sellers have gained control, pushing prices lower.
After a breakout, the market often retests the broken support or resistance level. Former resistance can become new support, while previous support may turn into new resistance. This role reversal helps traders confirm whether the breakout is genuine. If price holds above the new support or below the new resistance, it strengthens the case for a continued move in the breakout direction.
However, not every breakout is reliable, as false breakouts can occur. In these situations, price briefly moves past a support or resistance level and then quickly returns to the previous range. False breakouts are common during low-liquidity periods or around major economic announcements. Understanding this helps traders wait for confirmation, such as a strong candle close or sustained price movement, before entering trades.
Final Thoughts
Support and resistance are not optional skills; they are foundational. If you want to learn support and resistance in forex properly, think of them as a language the market speaks fluently. The more you observe, the more meaning you extract.
Mastery comes from practice, patience, and confluence—combining levels with trend direction, momentum, and confirmation. Once this foundation is solid, traders can confidently build toward advanced strategies without losing touch with price itself. Strong forex trading skills start here, at the levels where buyers and sellers quietly reveal their intentions.
FAQS

Support and resistance are zones, not exact lines. Price often reacts within a range due to liquidity, spreads, and market volatility rather than a single precise level.
Support and resistance do not predict price direction but help traders, identify high-probability entry points, set stop-loss and take-profit levels, and understand potential reversals and breakouts.
Support and resistance levels are probabilistic, not guaranteed. Their accuracy improves when combined with Candlestick patterns, Volume analysis, and Technical indicators.
Yes. Institutional traders use support and resistance to accumulate large positions, manage liquidity, trigger stop-loss orders. This is why price often reacts strongly around these levels.
Support and resistance are among the best concepts for beginners because they are simple to understand, highly visual and applicable across all markets and timeframes.
Yes. Scalpers frequently use support and resistance on lower timeframes to capture small price movements, especially during high-liquidity sessions.